


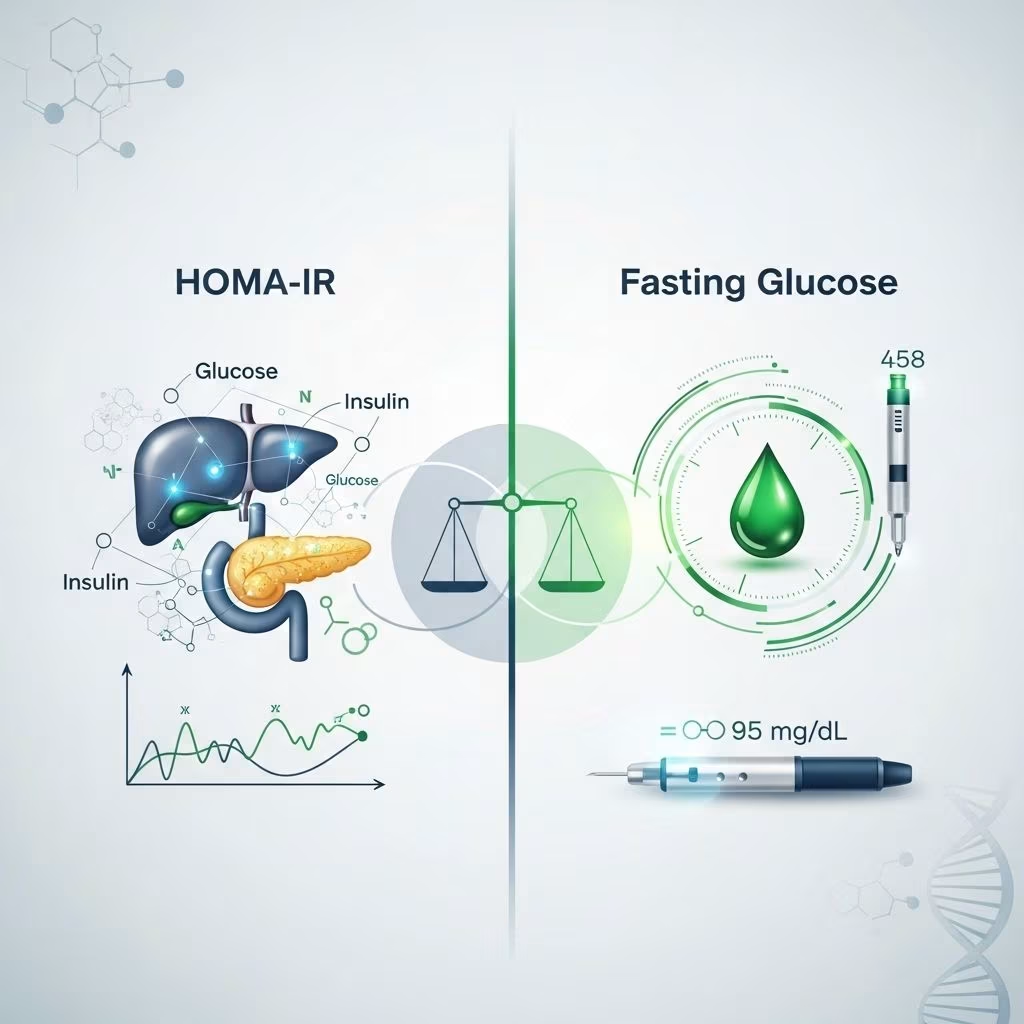
Metabolic health has become increasingly relevant in today’s society, with the incidence of insulin resistance (IR), prediabetes, and type 2 diabetes steadily rising around the globe. Among the numerous tools used to assess metabolic function, the fasting glucose test and the HOMA-IR (Homeostatic Model Assessment of Insulin Resistance) score are two of the most commonly employed biomarkers for evaluating glucose homeostasis and insulin sensitivity. While both are instrumental in clinical and research settings, understanding their differences, strengths, limitations, and applications is crucial for accurate diagnosis and effective disease management.
Introduction to Metabolic Assessment
The ability to maintain blood glucose levels within a narrow, healthy range is foundational for human health. Disorders in this balance can lead to significant metabolic disturbances, most notably insulin resistance, prediabetes, and diabetes. Physicians and researchers rely on a variety of biomarkers to gauge metabolic health, with fasting glucose and HOMA-IR offering practical options for clinical evaluation.
Understanding Fasting Glucose
Fasting glucose refers to the concentration of glucose in the blood after at least 8 hours of fasting. It is a fundamental screening tool for detecting abnormalities in glucose metabolism, particularly used for:
- Diagnosing Diabetes and Prediabetes: Elevated fasting glucose levels can indicate impaired glucose regulation, a hallmark of diabetes.
- Assessing Acute Health Changes: Fasting glucose can respond rapidly to new illness, inflammation, or metabolic stress.
- Routine Health Monitoring: It is commonly used in standard health panels due to its wide acceptance and cost-effectiveness.
The test is simple, inexpensive, and widely accessible. However, it mainly reflects the state of glucose regulation at a single time point and does not directly assess the body’s insulin response or broader insulin sensitivity.
Normal and Abnormal Ranges
- Normal fasting glucose: 70–99 mg/dL (3.9–5.5 mmol/L)
- Impaired fasting glucose (prediabetes): 100–125 mg/dL (5.6–6.9 mmol/L)
- Diabetes: ≥126 mg/dL (≥7.0 mmol/L) on two separate occasions
It is important to note that reference ranges may vary by laboratory and population group.
Understanding HOMA-IR Score
The HOMA-IR (Homeostatic Model Assessment of Insulin Resistance) score is a calculated index that incorporates both fasting glucose and fasting insulin levels. It provides an estimate of hepatic (liver) insulin resistance, which is a major driver of metabolic disease. HOMA-IR is calculated as follows:
HOMA-IR = (Fasting Insulin [µU/mL] x Fasting Glucose [mg/dL]) / 405Or, when glucose is measured in mmol/L:
HOMA-IR = (Fasting Insulin [µU/mL] x Fasting Glucose [mmol/L]) / 22.5Developed as a simpler and less invasive surrogate for the hyperinsulinemic-euglycemic clamp (the “gold standard” for measuring insulin resistance), HOMA-IR can be highly useful in both clinical and research settings.
Clinical Relevance
- Detecting Early Insulin Resistance: Often elevated before fasting glucose levels rise.
- Assessing Metabolic Risk: Higher scores are associated with an increased risk of metabolic syndrome, type 2 diabetes, and cardiovascular disease.
- Evaluation Across Populations: Valuable for risk stratification even in non-obese or non-diabetic individuals.
Drawbacks
- Limited to Hepatic IR: Primarily reflects the liver’s insulin resistance, and may not capture full-body insulin sensitivity.
- Requires Insulin Measurement: Fasting insulin assays are less standardized and more costly than glucose measurements alone.
- Influence of Other Factors: Levels can be affected by acute or chronic conditions, medications, and assay differences.
Key Differences: HOMA-IR Score vs. Fasting Glucose
Despite both being tools for assessing metabolic health, HOMA-IR and fasting glucose differ fundamentally in measurement, interpretation, and diagnostic power.
| Feature | Fasting Glucose | HOMA-IR |
|---|---|---|
| Primary Use | Detect glucose abnormalities/acutely | Estimate insulin resistance (mainly hepatic) |
| What It Measures | Glucose after fasting | Calculated from fasting glucose & insulin |
| Reflects | Acute metabolic changes | Chronic insulin resistance |
| Speed of Response | Rapid; reflects present state | Slower; changes over weeks/months |
| Required Tests | Blood glucose only | Fasting glucose and fasting insulin |
| Cost & Accessibility | Very low, widely available | Moderately higher; depends on insulin assay access |
| Normal Range | 70–99 mg/dL | Generally <2.0 (may vary by population) |
| Best Use Case | Diabetes diagnosis & monitoring | Early detection of insulin resistance & metabolic risk |
Diagnostic Utility and Clinical Application
In the clinical setting, both biomarkers provide valuable, often complementary information:
- Fasting Glucose is effective at detecting established abnormal glucose metabolism, and is a direct criterion for diagnosing diabetes and prediabetes.
- HOMA-IR can detect underlying or developing insulin resistance that precedes changes in glucose levels, making it particularly valuable for identifying individuals at risk for metabolic disease before overt hyperglycemia occurs.
It is common to use fasting glucose and HOMA-IR together for a broader metabolic evaluation, especially in the following scenarios:
- Evaluating metabolic syndrome or cardiovascular risk
- Screening at-risk but non-diabetic or non-obese individuals
- Conducting research on the pathogenesis of diabetes, hypertension, and metabolic disorders
Applicability in Special Populations
- Children/Adolescents: HOMA-IR proves valuable for early screening, especially in obesity or family history of metabolic disease.
- Lean Individuals: HOMA-IR can identify “hidden” insulin resistance not reflected by fasting glucose alone.
- Hypertensive or Dyslipidemic Patients: Elevated HOMA-IR is linked with increased cardiovascular risk even in those without diabetes.
Interpretation of Results and Cut-Off Values
Timely and accurate interpretation is essential to avoid misclassification or missed diagnosis:
- Fasting Glucose has clearly defined cut-offs for normality, impaired fasting glucose, and diabetes.
- HOMA-IR thresholds may vary, but a score of >2.0–2.5 is often suggested as indicating significant insulin resistance. However, values can differ depending on age, ethnicity, and reference population.
- For instance, a HOMA-IR cut-off of 2.5 was used in urban Indian adolescents, with adjusted cut-offs for different sensitivities and specificities.
- Among hypertensive patients, HOMA-IR values can be higher—sometimes >3.8 may denote insulin resistance in specific cohorts.
Clinical judgment and population context are necessary for meaningful interpretation.
Strengths and Limitations
Fasting Glucose
- Strengths:
- Simple and low-cost; standard diagnostic tool for diabetes screening
- Rapidly responsive to acute illnesses or metabolic stress
- Widely available and easily standardized
- Limitations:
- Single-point measurement; may miss early/metabolic changes
- Influenced by stress, illness, and recent lifestyle changes
- Cannot discern insulin resistance or beta-cell dysfunction
HOMA-IR
- Strengths:
- Detects early insulin resistance—critical for intervention before glucose rises
- Associates with cardiovascular, hepatic, and metabolic risks—even in non-diabetics
- Useful in research and epidemiological studies for population risk stratification
- Limitations:
- Requires reliable insulin assays, which are more variable and less standardized
- May not reflect muscle or whole-body insulin sensitivity as accurately as other indices (such as ISI-gly derived from oral glucose tolerance tests)
- Influenced by acute conditions, medications, and lab-specific protocols
Comparison Table: HOMA-IR vs. Fasting Glucose
| Parameter | Fasting Glucose | HOMA-IR |
|---|---|---|
| Primary Measurement | Blood glucose only | Calculated using fasting glucose and insulin |
| Main Role | Detects current glucose dysregulation | Estimates chronic insulin resistance |
| Timing Sensitivity | Reflects acute changes | Responds over weeks/months |
| Cost and Practicality | Low cost, routine test | Moderate cost, requires insulin assay |
| Population Reference Ranges | Well-defined by ADA/WHO | Variable; depends on ethnicity, BMI, assay |
| Early IR Detection | No | Yes |
| Limitation | Cannot assess insulin or beta-cell function | Does not reflect total (including peripheral) IR; requires more lab work |
Frequently Asked Questions (FAQs)
Q: Can a person have a normal fasting glucose but an abnormal (high) HOMA-IR score?
A: Yes. HOMA-IR can be elevated while fasting glucose remains normal, indicating early or “hidden” insulin resistance not yet causing measurable hyperglycemia.
Q: Is HOMA-IR the best test for insulin resistance?
A: HOMA-IR is a validated and practical surrogate marker for hepatic insulin resistance, but methods involving oral or intravenous glucose/insulin challenges (such as ISI-gly or glucose clamps) are more precise for whole-body sensitivity.
Q: Why do some labs have different reference ranges for HOMA-IR?
A: Variability in assay methods, population ethnicity, BMI, and age affect HOMA-IR cut-offs. Always interpret results in clinical and demographic context.
Q: Can HOMA-IR scores improve with lifestyle changes?
A: Yes. Evidence shows HOMA-IR decreases with effective weight loss, dietary improvement, increased activity, and management of comorbidities—even before fasting glucose levels normalize.
Q: How often should HOMA-IR or fasting glucose be measured?
A: Frequency depends on baseline risk, underlying health, and medical advice. Annual or biannual testing is common in at-risk or monitoring settings.
Conclusion
Both HOMA-IR score and fasting glucose are vital tools for assessing metabolic health. Fasting glucose provides a rapid, accessible way to detect current glucose regulation but may miss early or subclinical insulin resistance. HOMA-IR offers deeper insight into underlying insulin sensitivity, often flagging risk before overt disease develops. Used together, and interpreted in clinical context, these biomarkers empower physicians and individuals to identify risk earlier, prevent disease progression, and optimize metabolic health through tailored interventions.
References
- https://pmc.ncbi.nlm.nih.gov/articles/PMC9049152/
- https://mitohealth.com/compare/fasting-glucose-vs-homa-ir
- https://pubmed.ncbi.nlm.nih.gov/16052601/
- https://precisionhealthreports.com/comparing-4-different-measurements-for-insulin-resistance
- https://www.archivesofmedicalscience.com/How-much-insulin-resistance-in-polycystic-ovary-syndrome-Comparison-of-HOMA-IR-and,70220,0,2.html
- https://www.nature.com/articles/ijo2014134