


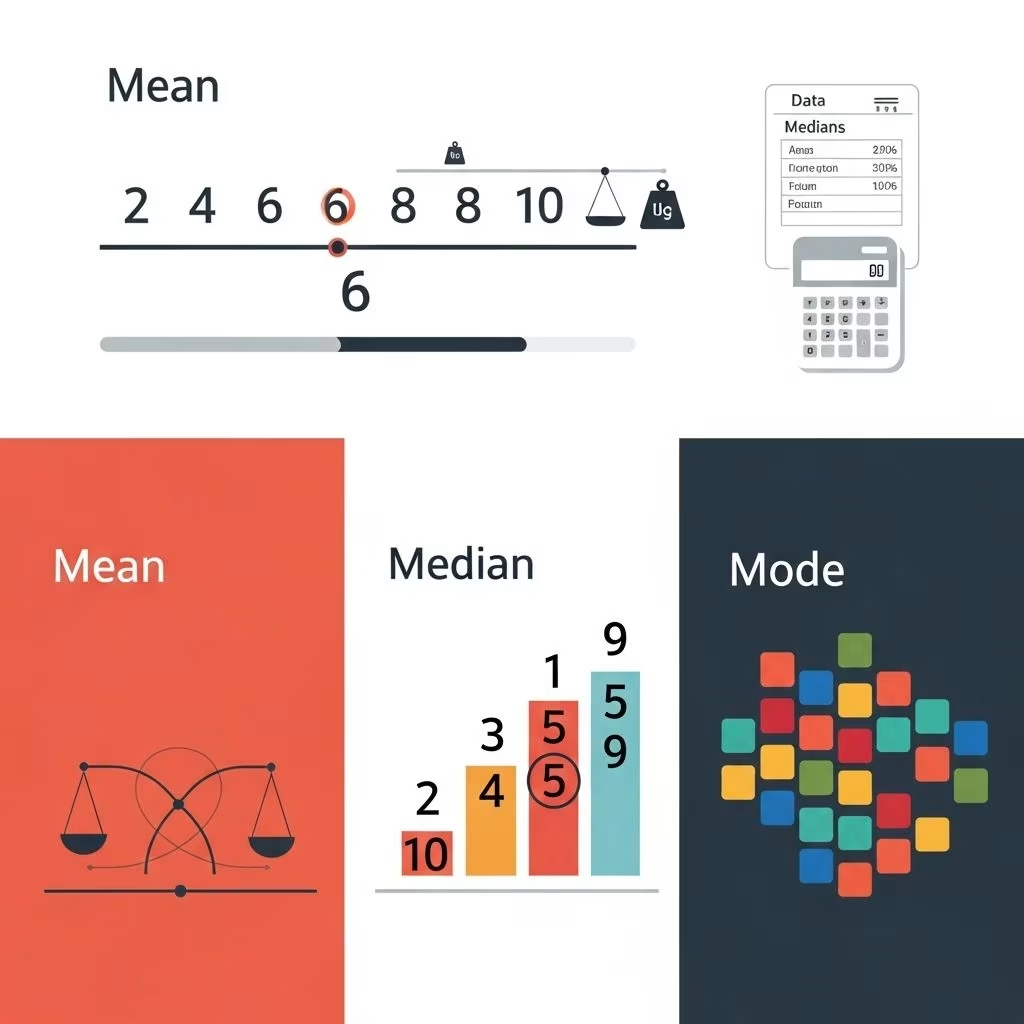
Understanding the mean, median, and mode is fundamental in statistics. These measures of central tendency can help summarize and interpret data sets in a clear and meaningful way. This article will walk you through what each term means, how to calculate them by hand, and how to interpret these values in practical contexts. Whether you are a student, teacher, or just someone interested in better understanding numbers, these concepts will give you a powerful set of analytical tools.
What Are Measures of Central Tendency?
Measures of central tendency are statistical values that represent the center point or typical value of a data set. The three most common measures are:
- Mean
often called the average - Median
the middle value in a data set - Mode
the most common value in a data set
Each measure can provide unique insights into the data, and understanding the differences between them is crucial for accurate analysis.
When to Use Mean, Median, or Mode
Different situations require different types of averages. Here’s a guide to determine which is appropriate to use:
- Mean: Use when you have interval or ratio data and the distribution is relatively symmetrical. The mean includes all data points in its calculation, so it’s sensitive to outliers.
- Median: Ideal for data with skewed distributions or outliers. The median is the middle value and not affected by extreme scores.
- Mode: Best for categorical data or when you want to know which value appears most frequently in a set.
In practice, it’s often useful to calculate all three measures to get a comprehensive picture of your data.
How to Calculate the Mean
Definition of the Mean
The mean, or average, is calculated by adding up all the numbers in a data set and then dividing the sum by the total number of values. It’s a commonly used measure because it considers every data point in the set.
Formula for the Mean
The arithmetic mean for a set of numbers is calculated as follows:
Mean = (Sum of all values) / (Number of values)Step-by-Step Example
Suppose you have the data set: 4, 8, 6, 5, 3, 7
- Add all the values: 4 + 8 + 6 + 5 + 3 + 7 = 33
- Count the total number of values: 6
- Divide the sum by the count: 33 / 6 ≈ 5.5
The mean of the data set is 5.5.
Another Example
Data set: 1, 2, 3, 4, 5Sum = 1 + 2 + 3 + 4 + 5 = 15Number of values = 5Mean = 15 / 5 = 3The mean is 3.
When the Mean Might Be Misleading
The mean can be skewed by extremely high or low values, known as outliers. For example, in a class of students with ages 8, 9, 9, 10, and 55, the mean age is much higher than the typical student.
How to Calculate the Median
Definition of the Median
The median is the middle value in a list of numbers when they are arranged in numerical order. If there is an even number of numbers, the median is the average of the two middle values.
Steps for Finding the Median
- Order the numbers from smallest to largest.
- If the number of values is odd, the median is the value at the center.
- If the number of values is even, the median is the average of the two middle values.
Step-by-Step Examples
Example 1: Odd Number of Values
Data set: 7, 3, 9, 2, 5Step 1: Order: 2, 3, 5, 7, 9Step 2: Middle value: 5 (third value of five)The median is 5.
Example 2: Even Number of Values
Data set: 1, 2, 3, 4, 5, 6Step 1: Order: 1, 2, 3, 4, 5, 6Step 2: Middle values: 3 and 4Median = (3 + 4) / 2 = 3.5The median is 3.5.
Why Use the Median?
The median is especially helpful for data sets with outliers or skewed distributions, since it’s not affected by values that are unusually high or low. For example, in the ages 22, 23, 24, 24, and 90, the median is 24, a better typical value than the mean, which would be raised by the age 90 outlier.
How to Calculate the Mode
Definition of the Mode
The mode is the value(s) that occur(s) most frequently in a data set. A data set may have one mode (unimodal), more than one mode (bimodal or multimodal), or no mode at all if all values are different.
Steps for Finding the Mode
- Arrange the data in order (optional, but helps visualize frequency).
- Count how many times each value appears.
- The value with the highest frequency is the mode.
Step-by-Step Examples
Example 1
Data set: 2, 4, 4, 6, 8, 4, 10Count of each value:2: 14: 36: 18: 110: 1Mode: 4 (occurs most often)The mode is 4.
Example 2
Data set: 5, 7, 8, 7, 5, 95: 27: 28: 19: 1Modes: 5 and 7 (bimodal)This set is bimodal: 5 and 7 are both modes.
When Mode is Most Useful
The mode is especially useful when analyzing categorical data (data belonging to categories) or when you want to identify the most popular value in a set, such as the most common shoe size sold in a store.
Comparing Mean, Median, and Mode
| Measure | Definition | When Best Used |
|---|---|---|
| Mean | Sum of all values divided by the number of values | When data has no extreme outliers or skew |
| Median | Middle value when data set is ordered | For skewed data or when outliers are present |
| Mode | Most frequent value in the data set | For categorical data, or to find the most common item/value |
Formulas for Mean, Median, and Mode
- Mean:
Mean = (x_1 + x_2 + ... + x_n) / n - Median (odd data set): Value at position
(n + 1) / 2in ordered data - Median (even data set): Average of values at positions
n/2and(n/2) + 1 - Mode: Most frequently occurring value
Worked-Out Examples
Example 1: Finding the Mean, Median, and Mode
Data set: 9, 4, 4, 10, 12, 7, 10
- Mean: (9 + 4 + 4 + 10 + 12 + 7 + 10) / 7 = 56 / 7 = 8.0
- Median (order: 4, 4, 7, 9, 10, 10, 12): 9 (middle value)
- Mode: 4 and 10 (both occur twice – bimodal dataset)
Example 2: Data Set with No Mode
Data set: 3, 5, 7, 9, 11
- Mean: (3 + 5 + 7 + 9 + 11) / 5 = 35 / 5 = 7
- Median: 7
- Mode: None (no repeated numbers)
Tips for Calculating Mean, Median, and Mode
- Double-check that you have included all values in the sum when computing the mean.
- Always order your data set before looking for the median.
- Make a frequency table to quickly find the mode, especially in large data sets.
- If your data includes words or categories (such as eye color), you can only calculate the mode, not mean or median.
- When data has more than one mode, it can be called bimodal or multimodal.
Common Pitfalls and How to Avoid Them
- Outliers Skewing the Mean: Extreme values can bias the mean, so check for outliers before deciding if the mean is a good summary.
- Confusing the Median with the Mean: Remember: the median is the central value, not the average.
- Ignoring the Mode: In some cases (especially with survey or categorical data), the mode may be the most important measure.
- Not Ordering Data for Median: The median requires an ordered data set; skipping this step can lead to mistakes.
When Results Differ — Interpreting Discrepancies
Sometimes, the mean, median, and mode have different values for the same data set. This often occurs when:
- The data set is skewed (not symmetrical).
- There are outliers or unusual values.
- The data is bimodal or multimodal.
Understanding the shape and nature of your data can help you choose the most representative statistic.
Applications of Mean, Median, and Mode in Real Life
- Mean is often used for consensus measures, like average household income, average test scores, or average temperature.
- Median is widely used in reporting income, property values, and house prices, since it better represents the typical value unaffected by outliers.
- Mode is commonly used to determine the most popular product size, the most common medical diagnosis, or the dominant opinion in surveys.
Frequently Asked Questions (FAQs)
Q: Can a data set have more than one mode?
A: Yes. If two or more values tie for the highest frequency, the data set is considered bimodal (two modes) or multimodal (more than two). Sometimes, a set can also have no mode if all values are unique.
Q: What happens to the mean if an outlier is added?
A: The mean will change, often substantially, because it factors in all values. For example, if you add a very large number to a set of smaller numbers, the mean will increase noticeably, even if all other numbers remain the same.
Q: Why are medians used instead of means for salaries and house prices?
A: Medians are preferred in these contexts because they do not exaggerate the impact of a few extremely high or low values, making them more representative of the typical case.
Q: Is the mode always unique?
A: No. Data sets can be bimodal, multimodal, or have no mode at all. The mode is only unique if one value occurs more frequently than all others.
Q: Can you have a mean, median, or mode for categorical data?
A: Only the mode can be used for purely categorical data (like colors or types), as calculating a mean or median requires numerical values.
Summary: Choosing the Right Measure
- Choose the mean for symmetrical, outlier-free data where every value is meant to be considered.
- Choose the median when your data has outliers or is skewed.
- Choose the mode when interested in the most common item or for categorical data.
When in doubt, report all three to provide a fuller picture. Mastery of these concepts is essential in statistics and interpreting data-driven findings.
References
- https://www.cuemath.com/mean-median-mode-formula/
- https://www.statisticshowto.com/probability-and-statistics/statistics-definitions/mean-median-mode/
- https://byjus.com/maths/mean-median-mode/
- https://www.geeksforgeeks.org/maths/mean-median-mode/
- https://www.calculatorsoup.com/calculators/statistics/mean-median-mode.php
- https://www.khanacademy.org/math/statistics-probability/summarizing-quantitative-data/mean-median-basics/a/mean-median-and-mode-review
- https://ledidi.com/academy/measures-of-central-tendency-mean-median-and-mode
- https://www.youtube.com/watch?v=HbqPbg5pVE0
- https://www.purplemath.com/modules/meanmode.htm
- https://www.prodigygame.com/main-en/blog/how-to-find-mean-median-mode