


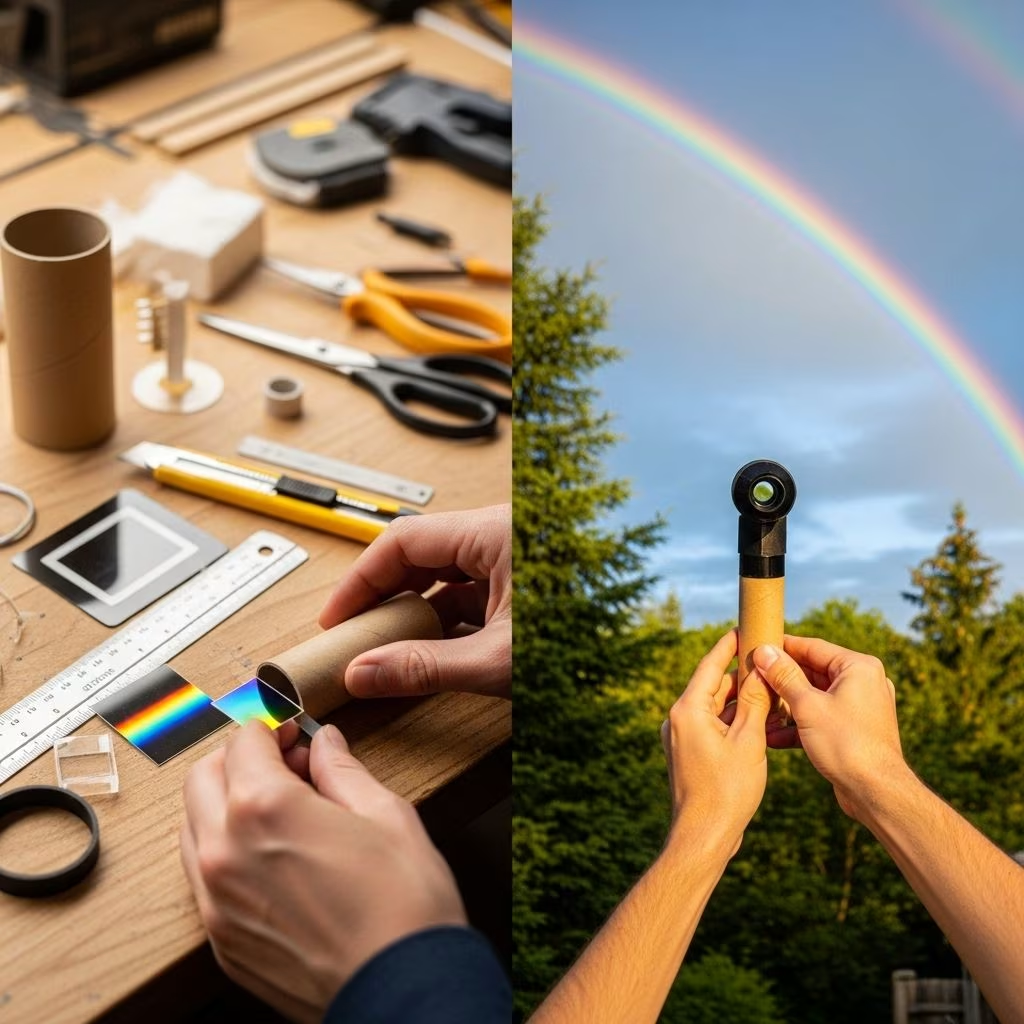
Introduction to Spectroscopy
A spectroscope is a fascinating scientific instrument that breaks down light into its component colors, revealing the hidden spectrum within everyday light sources. Building your own DIY spectroscope opens up an exciting world of scientific exploration, allowing you to analyze outdoor light sources, compare different types of illumination, and understand the fundamental nature of light and color. This simple yet powerful tool has been used by scientists for centuries to study everything from distant stars to the composition of materials here on Earth.
Creating a homemade spectroscope is an excellent educational project that combines hands-on crafting with real scientific investigation. Whether you’re a student, educator, parent, or curious enthusiast, constructing this device requires only basic materials that you likely already have at home. The beauty of this project lies in its simplicity and the profound insights it provides into the electromagnetic spectrum and how we perceive color in our natural environment.
Understanding How Spectroscopes Work
The fundamental principle behind a spectroscope involves light diffraction, which is the bending and spreading of light waves as they pass through or reflect off a surface with fine, regularly spaced grooves. When white light enters your spectroscope through a narrow slit, it encounters a diffraction grating—typically created using an old CD or DVD. These discs contain microscopic tracks or pits that are evenly spaced across their surface, creating the perfect conditions for light separation.
As light hits the grooved surface of the CD, different wavelengths of light bend at slightly different angles. This process separates white light into its constituent colors, creating a visible spectrum that ranges from red (longest wavelength) through orange, yellow, green, blue, and violet (shortest wavelength). The mirrored surface of the CD reflects these separated colors back to your eye through a viewing hole, making them visible as distinct bands of color.
The quality of your spectroscope’s output depends on several factors, including the narrowness of the entrance slit, the quality of the diffraction grating, and the darkness of the interior tube. A narrower slit produces sharper, more defined spectral lines, while a darker interior prevents stray light from interfering with your observations. Understanding these principles helps you optimize your design for the best possible results when analyzing outdoor light sources.
Materials Needed for Your DIY Spectroscope
One of the most appealing aspects of this project is its accessibility. You can build a functional spectroscope using common household items and basic craft supplies. The core materials include a cardboard tube from a paper towel or toilet paper roll, which serves as the main body of your instrument. This tube provides the necessary length for light to travel and keeps the interior dark to prevent interference.
The diffraction grating is the heart of your spectroscope, and fortunately, you can create an excellent grating from an old CD or DVD. DVDs tend to work slightly better because they can be easily separated into two layers, with the bottom layer containing the crucial grooves. If you’re using a CD, you’ll need to carefully cut a small triangular or rectangular piece from it. The shiny, reflective side with the visible tracks is what creates the diffraction effect.
Additional materials include black construction paper or black masking tape to line the interior of your tube, creating a dark, non-reflective surface. You’ll need scissors or a craft knife for cutting (adult supervision recommended for younger builders), regular tape for assembly, and small pieces of cardboard or cardstock to create the end caps. Optional materials include paint to decorate your spectroscope’s exterior, though this is purely aesthetic and doesn’t affect functionality.
| Material | Purpose | Alternative Options |
|---|---|---|
| Paper towel roll | Main tube body | Toilet paper roll, cardboard sheet rolled into tube |
| Old CD or DVD | Diffraction grating | Commercial diffraction grating film |
| Black construction paper | Interior lining | Black masking tape, black paint |
| Cardstock | End caps | Thin cardboard, thick paper |
| Tape | Assembly | Glue, adhesive |
Step-by-Step Building Instructions
Preparing the Diffraction Grating
Begin by preparing your diffraction grating from an old CD or DVD. If using a DVD, make a small cut at the edge and carefully separate the two layers using your fingernails. The bottom layer, which contains all the data grooves, is your diffraction grating. For a CD, you’ll need to cut a small piece, approximately 2-3 cm square, from the disc. Handle this piece carefully to avoid scratches, as any damage to the grooved surface will affect the quality of your spectrum. The shiny, reflective side should face upward when installed in your spectroscope.
Preparing the Cardboard Tube
The interior of your cardboard tube must be as dark and non-reflective as possible to produce clear spectral images. Line the inside completely with black construction paper, securing it with glue or tape. Alternatively, you can wrap the exterior and interior with black masking tape, which provides excellent light absorption. If using paint, apply several coats of matte black paint and allow it to dry completely before proceeding. This step is crucial because any stray light reflecting inside the tube will wash out your spectrum and make observations difficult.
Creating the Entrance Slit
Trace one end of your cardboard tube onto a piece of cardstock or cardboard to create a circular end cap. Cut this circle out carefully, making it slightly larger than the tube opening. In the center of this circle, you need to create a very narrow slit for light to enter. This is one of the most critical steps—the narrower and straighter your slit, the sharper your spectral lines will be. One effective method is to cut a rectangular hole about 2.5 cm long in the center, then tape two straight-edged rectangles of black paper over it, leaving only a narrow gap of about 1-2 mm between them. Position these rectangles carefully to ensure the slit is straight and uniform.
Installing the Diffraction Grating
Using your craft knife, cut a viewing hole on one side of the tube near one end—this is where you’ll look through to see the spectrum. Directly opposite this viewing hole, at approximately a 45-degree angle, cut a diagonal slit just large enough to hold your CD piece. The CD should be inserted with the shiny, grooved side facing the interior of the tube and angled toward the viewing hole. This positioning allows the diffracted light to reflect directly to your eye when you look through the viewing hole. Secure the CD in place with small pieces of tape, being careful not to cover the grooved surface.
Final Assembly
Create a second end cap by tracing and cutting another circle from cardstock. In the center of this cap, cut a small square opening, about 1.5 cm on each side. Tape your remaining CD piece over this hole from the inside, with the grooved side facing inward. This creates a viewing window. However, for the simpler paper-towel-roll design, you may instead attach the slit cap to one end and leave the other end open with just the angled CD insert. Test your spectroscope by holding the slotted end toward a light source and looking through the viewing hole. You should see a spectrum appear inside the tube. If the spectrum is narrow or unclear, rotate the end cap slightly until the spectrum widens and becomes more distinct, then tape it permanently in place.
Using Your Spectroscope Outdoors
Taking your newly constructed spectroscope outdoors opens up a world of observational opportunities. The most accessible outdoor light source is natural skylight—not direct sunlight, which should never be viewed through any optical instrument as it can cause serious eye damage. Instead, point the entrance slit toward a bright area of clear blue sky, away from the sun. Looking through the viewing hole, you should see a continuous spectrum displaying all the colors of the rainbow in order: red, orange, yellow, green, blue, and violet. This represents the full visible spectrum of sunlight scattered by Earth’s atmosphere.
The quality of your outdoor observations depends significantly on lighting conditions and time of day. Morning and late afternoon light, when the sun is lower on the horizon, passes through more atmosphere and may show slightly different spectral characteristics than midday light. On cloudy days, the diffused light through clouds still produces a visible spectrum, though it may appear less intense than on clear days. Experimenting with different weather conditions and times provides valuable insights into how atmospheric conditions affect light quality and color composition.
For safety and optimal results, always position yourself so the entrance slit faces the sky but never points directly at the sun. Hold the spectroscope steady and allow your eyes a moment to adjust to the viewing conditions. You may need to slightly adjust the angle of the spectroscope to bring the spectrum into clearer view. The beauty of outdoor spectroscopy is that you can conduct observations anywhere—your backyard, a park, or even an urban environment—making it an extremely portable and versatile scientific tool.
Analyzing Different Outdoor Light Sources
Beyond natural skylight, numerous outdoor artificial light sources provide fascinating subjects for spectroscopic analysis. Street lamps, for instance, come in several varieties, each producing distinctly different spectra. Traditional sodium vapor lamps, which emit a characteristic orange glow, show a spectrum dominated by yellow-orange lines with very little output in other colors. This limited spectrum is why sodium lamps make everything look monochromatic and why they’re being phased out in many cities.
Modern LED street lighting produces a markedly different spectrum. When viewed through your spectroscope, LED lights typically show a strong blue spike with varying amounts of yellow, orange, and red, depending on the LED’s color temperature and phosphor coating. This helps explain why some LED lighting appears harsh or cold compared to traditional incandescent sources. Mercury vapor lamps, still common in some parking lots and industrial areas, display several distinct spectral lines, including prominent blue-green and yellow emissions, creating a discontinuous spectrum quite different from sunlight’s smooth rainbow.
Neon signs and fluorescent outdoor lighting also produce characteristic line spectra rather than continuous spectra. A neon sign glowing red shows intense red and orange spectral lines with little emission in other colors. Different noble gases produce different colors—argon creates blue-purple, while other gas mixtures create various hues. These observations demonstrate how different light sources produce light through different physical mechanisms, providing practical lessons in atomic physics and the quantum nature of light emission.
Vehicle headlights offer another interesting comparison. Older halogen headlights produce a spectrum similar to sunlight but slightly shifted toward yellow-orange, while newer xenon (HID) headlights show a spectrum with more blue content and several distinct spectral lines. LED headlights, increasingly common on modern vehicles, display the characteristic LED spectrum with its blue spike. Observing and comparing these different sources helps develop understanding of color temperature, light quality, and why different types of lighting create different visual experiences.
The Science Behind Light and Color
Understanding what you observe through your spectroscope requires some knowledge of light’s fundamental nature. Light is electromagnetic radiation that travels in waves, and different colors correspond to different wavelengths. Red light has the longest visible wavelength at approximately 700 nanometers, while violet light has the shortest at around 400 nanometers. The other colors fall between these extremes, with each color representing a specific range of wavelengths.
White light, such as sunlight or light from an incandescent bulb, contains all visible wavelengths mixed together. When this mixture enters your spectroscope and hits the diffraction grating, each wavelength is bent by a slightly different amount—a phenomenon called dispersion. Longer wavelengths (red) are bent less than shorter wavelengths (violet), causing the colors to spread out in order. This is the same principle that creates natural rainbows, where water droplets act as tiny prisms, separating sunlight into its component colors.
The type of spectrum you observe reveals important information about the light source’s nature. A continuous spectrum, showing all colors smoothly blending from red to violet, indicates the light comes from a hot, dense source like the sun or an incandescent filament. This type of emission is called blackbody radiation. In contrast, a line spectrum, showing only specific colors or narrow bands, indicates light produced by excited atoms in a gas. Each element produces a unique set of spectral lines, which is why spectroscopy is such a powerful tool for identifying the composition of distant stars and other celestial objects.
The interaction between light and matter also explains why we see colors in objects around us. When white light strikes an object, certain wavelengths are absorbed while others are reflected. The reflected wavelengths reach our eyes and determine the object’s perceived color. A red apple appears red because it reflects red wavelengths and absorbs most other colors. Through spectroscopic analysis, we can understand these interactions more deeply and appreciate how the physics of light shapes our visual experience of the world.
Troubleshooting Common Issues
Even with careful construction, you may encounter some challenges when first using your spectroscope. One common issue is seeing no spectrum at all or only a very faint one. This usually indicates a problem with the entrance slit or interior darkness. Check that your entrance slit is truly narrow—ideally just 1-2 millimeters wide—and that it’s illuminated by a sufficiently bright light source. Also verify that the interior of your tube is completely dark and non-reflective, with no light leaks where the end caps meet the tube.
If you see multiple spectra or confusing patterns, the diffraction grating may be positioned incorrectly or the viewing angle needs adjustment. The CD piece should be angled at approximately 45 degrees, with the grooved side facing the interior of the tube. Try rotating the end cap or adjusting the CD’s angle until you achieve a single, clear spectrum. Sometimes the spectrum appears on both sides of the slit; this is normal, but one side is usually clearer than the other. Rotate your view to focus on the clearest image.
A spectrum that appears blurred or has poorly defined color boundaries typically results from too wide an entrance slit. The narrower the slit, the sharper your spectral lines will be. If your current slit is too wide, you can narrow it by adding additional layers of black paper to the edges, effectively reducing the opening. Alternatively, you can replace the entire slit cap with a new one featuring a narrower opening. Remember that finding the optimal slit width involves some trial and error, but the effort pays off in dramatically improved image quality.
Scratches or fingerprints on the CD surface can also degrade performance. Handle your diffraction grating carefully by the edges and avoid touching the grooved surface. If the CD becomes dirty, clean it gently with a soft, lint-free cloth, wiping from the center outward in straight lines rather than circular motions. If scratches are severe, you may need to prepare a new diffraction grating from a fresh disc. Prevention is easier than repair, so handle this crucial component with care from the start.
Advanced Observation Techniques
Once you’ve mastered basic spectroscopic observations, several advanced techniques can enhance your investigations. Comparative spectroscopy involves systematically observing and documenting different light sources under similar conditions, then comparing their spectra. Create a logbook where you sketch or describe the spectra you observe, noting the light source type, time of day, weather conditions, and any distinctive features like the presence of specific spectral lines or the relative brightness of different colors.
Photography adds another dimension to your observations. While challenging with a simple spectroscope, you can sometimes capture spectral images by holding a smartphone camera up to the viewing hole in a darkened environment. The camera needs to be perfectly aligned and the entrance slit must be directed at a bright light source. Digital images allow for detailed comparison and can reveal subtle features not immediately apparent to the naked eye. Experiment with different exposure settings to capture the full range of colors without overexposing the brighter portions of the spectrum.
Quantitative measurements elevate your spectroscope from a qualitative demonstration tool to a semi-quantitative instrument. Create a scale inside your spectroscope tube by marking wavelength positions with a thin strip of paper. You can calibrate this scale using known spectral lines from sources like sodium lamps or mercury vapor lights, whose wavelengths are well documented. This allows you to estimate the wavelengths of unknown spectral features, though precision will be limited compared to professional instruments.
For truly advanced work, consider building multiple spectroscopes with different specifications and comparing their performance. Experiment with different diffraction gratings—some commercial gratings have different groove densities that affect spectral resolution. Try various tube lengths to see how this affects the spread and clarity of your spectrum. Build one optimized for bright outdoor sources and another with a wider slit for dimmer sources. This comparative approach teaches important lessons about instrument design and the trade-offs involved in optical systems.
Educational Activities and Experiments
A DIY spectroscope provides endless opportunities for structured educational activities. One engaging exercise involves creating a light source survey, where students or participants systematically observe and classify all the different outdoor light sources in their neighborhood. This teaches observational skills, data recording, and pattern recognition while introducing concepts from atomic physics and lighting technology. Participants can create visual representations of different spectra and discuss why different technologies produce different colors.
Seasonal variations in natural light offer another fascinating investigation. Observe and document skylight spectra at different times of year, comparing summer and winter observations. Discuss how the sun’s angle and atmospheric conditions affect the light reaching us. This connects spectroscopy to Earth science, meteorology, and astronomy. Students can hypothesize about why certain conditions produce different appearances and then test their ideas through systematic observation.
A particularly valuable activity involves connecting spectroscopy to energy efficiency and environmental science. Compare the spectra of old incandescent outdoor lighting with modern LED alternatives and discuss the implications for energy consumption, light quality, and environmental impact. This real-world application demonstrates how scientific understanding informs technological choices and policy decisions. Students can investigate why many cities are transitioning to LED street lighting and evaluate both the benefits and drawbacks from multiple perspectives.
For younger learners, rainbow hunts provide an accessible introduction to spectroscopy concepts. Challenge children to find and observe different colored lights outdoors, using their spectroscope to discover that white-looking lights actually contain many colors. This hands-on exploration builds intuition about light and color that forms the foundation for more advanced scientific understanding. The act of building the spectroscope itself teaches valuable skills in following instructions, problem-solving, and working with simple tools.
Frequently Asked Questions (FAQs)
Q: Can I safely observe the sun with my spectroscope?
A: No, never point your spectroscope directly at the sun. Even with a spectroscope, direct solar observation can cause serious and permanent eye damage. Instead, observe bright areas of sky away from the sun, which still provides excellent spectral views of sunlight scattered by the atmosphere.
Q: Why does my spectroscope show a rainbow instead of distinct lines?
A: You’re likely observing a continuous spectrum from sources like sunlight or incandescent bulbs, which emit all wavelengths. This produces a smooth rainbow. To see distinct spectral lines, observe gas-discharge lamps like neon signs, sodium street lights, or fluorescent fixtures, which emit light at specific wavelengths.
Q: How narrow should my entrance slit be?
A: The ideal slit width is approximately 1-2 millimeters. Narrower slits produce sharper, more defined spectral lines but require brighter light sources. If your spectrum appears too dim, you can slightly widen the slit, though this will reduce resolution. Finding the optimal balance depends on your light sources and observation conditions.
Q: Can I use a DVD instead of a CD for the diffraction grating?
A: Yes, DVDs often work better than CDs because they can be easily separated into two layers, and the bottom layer provides an excellent diffraction grating with finer grooves. The separation process is simple—just make a small cut at the edge and peel the layers apart using your fingernails.
Q: What’s the difference between what I see through my spectroscope and a rainbow?
A: Both display the visible spectrum, but your spectroscope uses diffraction from regularly-spaced grooves to separate light, while rainbows use refraction and reflection in water droplets. Your spectroscope can analyze any light source, not just sunlight, and reveals differences between sources that aren’t apparent in natural rainbows.
Q: How can I improve the quality of my spectroscope’s images?
A: Focus on three key areas: make the entrance slit as narrow and straight as possible, ensure the interior is completely dark and non-reflective, and handle the diffraction grating carefully to avoid scratches. Also, experiment with the angle of the CD and the positioning of the viewing hole to optimize the reflected spectrum’s path to your eye.
Q: What outdoor light sources produce the most interesting spectra?
A: Different types of street lighting produce fascinating spectra—sodium vapor lamps show distinctive orange-yellow lines, mercury vapor displays blue-green peaks, and LEDs show characteristic blue spikes. Also try observing neon signs, different types of vehicle headlights, and even the moon’s reflected sunlight for comparative analysis.
Q: Can I use my spectroscope indoors as well?
A: Absolutely. Indoor light sources like fluorescent bulbs, LED lighting, incandescent lamps, and even candle flames each produce distinctive spectra. Comparing indoor and outdoor sources helps illustrate how different mechanisms of light production create different spectral characteristics, deepening understanding of light’s fundamental nature.
References
- https://buggyandbuddy.com/homemade-spectroscope/
- https://learning-center.homesciencetools.com/article/how-to-make-a-spectroscope-science-project/
- https://www.youtube.com/watch?v=fW4aMOSVv_8
- https://www.instructables.com/DIY-Low-Cost-Spectrometer/
- https://www.instructables.com/DIY-Spectroscope/
- https://www.amnh.org/content/download/45894/703630/file/building-a-spectroscope.pdf
- https://www.youtube.com/watch?v=X-lqK6LgAPY
- https://uwaterloo.ca/chem13-news-magazine/december-2015-january-2016/feature/pizza-box-spectroscope-construction-part-1
- https://www.swpc.noaa.gov/sites/default/files/images/u2/Activity_1_mod2-FINAL.pdf