


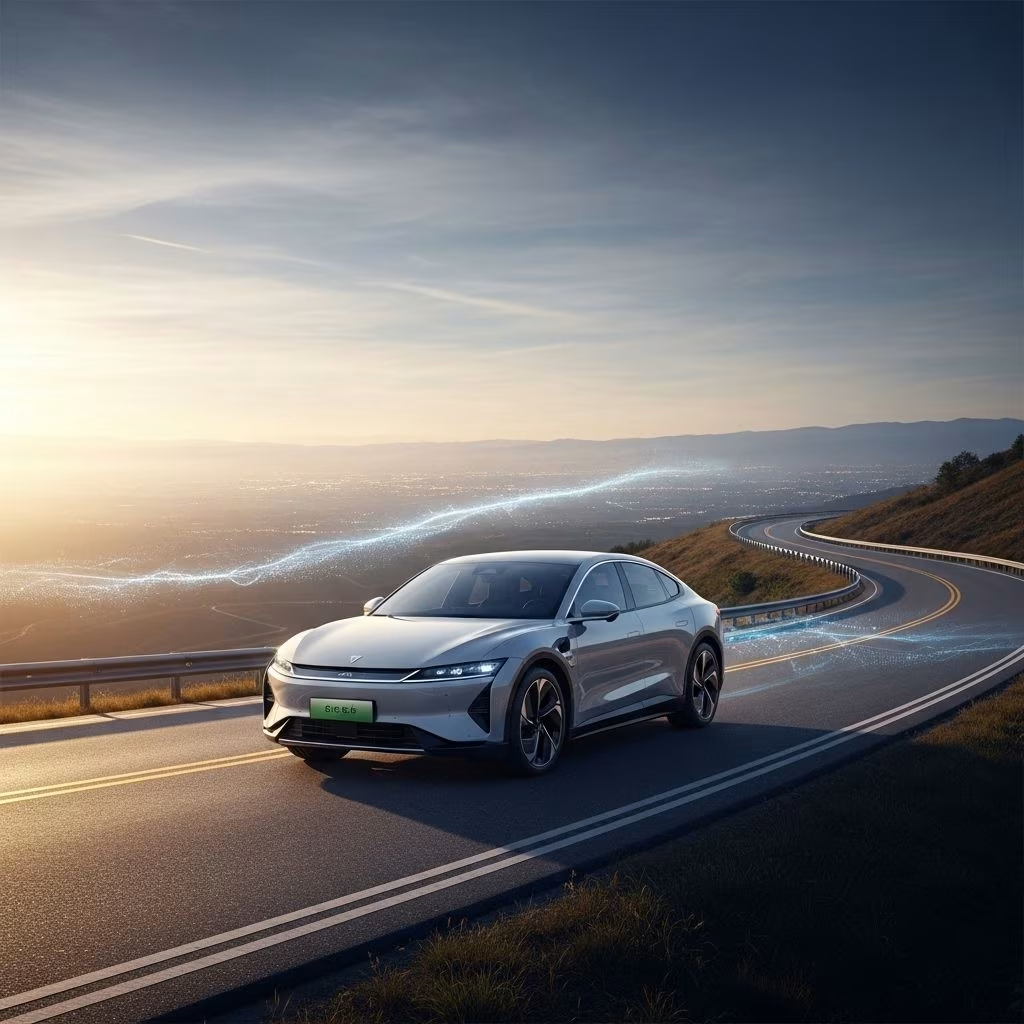
U.S. Electric Vehicle Adoption: A Steady but Slow Climb
Electric vehicle (EV) adoption in the United States has been marked by slow but permanent change, reflecting gradual shifts in consumer sentiment, regional differences, and infrastructural challenges. Although the U.S. trails China and Europe in overall EV market share, recent trends reveal a nation warming up to the promise of electrification, especially as satisfaction among current owners remains high and state-level policies drive innovation.
Understanding the Current Landscape
- Only 10% of new vehicles sold in the U.S. are fully electric, compared to nearly 50% in China and 21% in Europe.
- Despite gradual growth, 91% of existing EV owners say they would not revert back to gasoline vehicles.
- Consumer intent is rising: 29% of Americans now consider an EV for their next car, up 5% from last year.
- Regional fragmentation persists, with states following progressive regulations (like California) showing higher adoption rates.
EV Growth Patterns: The S-Curve Acceleration
EV adoption in the U.S. reflects a classic S-curve trajectory observed in other disruptive technologies. After years of slow growth, adoption accelerates once a market reaches critical thresholds.
- The U.S. hit the 1% threshold in 2017, 5% in 2022, and 10% in 2023—entering a phase where adoption rates can sharply increase as technology, pricing, and infrastructure improve.
- Internationally, China leads the late majority phase, but the U.S. is positioned in the early stages of mass uptake.
- Key drivers include economies of scale in battery manufacturing, falling costs, and social diffusion.
Regional Trends: States Driving the EV Revolution
The U.S. map of EV adoption is a patchwork of leadership, innovation, and challenges. Certain states—often motivated by climate policies and incentives—dramatically outpace others.
| State | EVs Registered (2023) | Policy or Incentive Highlight |
|---|---|---|
| California | 1,256,646 | 100% emission-free goal by 2035, robust charging network, state grants up to $7,500 |
| Florida | 254,878 | Rapid adoption, expanding infrastructure |
| Texas | 230,125 | Emerging manufacturing hub; incentives |
| Washington | 152,101 | Highest per capita EV rate after California; hydropower-driven clean energy |
| New York | 131,250 | Network expansion, incentives |
| New Jersey | 134,753 | Charging network development, local rebates |
These states exemplify how a combination of ambitious policies, manufacturing investment, and persistent infrastructure expansion fuels local adoption rates far above the national average.
- California: With more than 1.3 million EVs and over 50,000 public charging outlets, California’s leadership is driven by regulatory mandates and broad incentive programs.
- Washington: A focus on clean hydropower and unique policy innovation makes EVs a low-carbon choice for residents.
- Texas, Florida, Arizona: Traditionally fossil fuel-intensive states now see increased adoption, propelled by local manufacturing and incentives.
- Smaller states like Vermont prove that policy ambition and targeted incentives can quicken adoption rates.
Consumer Sentiment: From Hesitation to Lasting Change
Despite notable regional advances, overall consumer sentiment in the U.S. remains cautious. Confidence in EVs is growing, but several persistent concerns continue to slow the rate of change.
- Range Anxiety: Most consumers expect at least 310 miles per charge to feel comfortable.
- Cost and Affordability: High battery replacement and purchase costs deter buyers. AAA found that 59% of those surveyed cited purchase price as a barrier, while 62% worry about battery repair costs.
- Charging Infrastructure: Only 16% of Americans are “very likely” or “likely” to choose an EV for their next car, in part due to the uneven distribution of charging stations.
- Long-Term Satisfaction: Despite obstacles, 91% of current EV owners report they don’t plan to go back to gasoline power.
Barriers in Detail
- Concerns over long-distance travel: 57% say EVs aren’t yet suited for road trips or extended driving.
- Lack of convenient public charging: 56% of Americans cite this as a main barrier.
- Fear of running out of charge: 55% of respondents worry about being stranded.
- Residential charging challenges: 27% have issues installing chargers at home.
- Depreciation and ownership costs: According to AAA, EVs have the second-highest total cost of ownership.
Global Perspective: How the U.S. Compares
The United States lags behind Europe and China in raw market share and expansion, but internal trends show promising progress.
| Country/Region | 2025 Market Share (%) | Consumer Sentiment | Key Challenges |
|---|---|---|---|
| China | ~50 | 82% intent for next EV purchase | Infrastructure, edge-case range |
| Europe | 21 | Steady growth, moderate enthusiasm | Price, regulation, country variation |
| United States | 10 | Rising, but still cautious | Cost, range, charging access |
China continues to push the EV market, driven by consumer demand rather than regulation, while Europe follows with a diverse, moderately expanding market. The U.S. still faces fragmented uptake but is poised for acceleration if infrastructure and affordability improve.
Infrastructure: The Road To Mass Adoption
Expanded charging infrastructure remains critical to wider EV adoption. California alone boasts over 50,000 public charging stations, but many states lag behind. EV-to-charger ratios spotlight the urgent need for investment.
- Urban vs Rural Divide: Urban regions offer far more chargers and public support; rural areas still struggle.
- State Investments: California, New York, and New Jersey are rapidly expanding their networks.
- Federal Incentives: Tax credits and grants supplement state programs but fluctuate with political priorities.
Policy & Incentives: Catalysts for Change
Government incentives continue as a potent tool for supporting EV adoption. The combination of federal tax credits, state-level rebates, and local infrastructure initiatives can tip consumer calculations.
- California’s Clean Vehicle Assistance Program: Offers grants of up to $7,500 for low-income buyers.
- Zero Emissions Mandates: Several states—led by California—aim for 100% clean passenger vehicle sales by 2035.
- Manufacturing Support: Texas leverages its industrial base for up-and-coming EV factories, signaling a strategic shift.
Permanent Shifts: EV Owners Don’t Go Back
Once someone switches to an electric vehicle, the shift appears lasting. U.S. surveys reveal that over 90% of owners have no plans to return to internal combustion models. Nearly three-quarters intend for their next purchase to be another EV.
- Drivers cite quiet operation, low maintenance, and fuel savings as long-term benefits.
- Environmental awareness grows as climate policies and wildfire risks shape buying decisions.
- Social diffusion through peer networks and community programs accelerates reputation and acceptance.
Challenges and Opportunities Ahead
The road to mass EV adoption in the U.S. requires confronting tough challenges while capitalizing on unique opportunities.
- Technological Innovation: Battery advances, longer ranges, and increased model diversity are emerging.
- Cost Parity: As economies of scale improve, EV prices are expected to fall further, matching traditional vehicles by the late 2020s.
- Social and Cultural Shifts: Peer influence, climate urgency, and generational change could accelerate conversion rates.
- Infrastructure Expansion: More reliable and accessible charging is a near-term priority.
Frequently Asked Questions (FAQs) on U.S. Electric Vehicles
Q: Why is U.S. EV adoption slower than in Europe and China?
A: Several factors contribute, including higher upfront costs, less extensive charging infrastructure, regional policy fragmentation, and greater consumer skepticism about range and practicality.
Q: Are EV owners satisfied with their vehicles?
A: Yes. Over 90% of current EV owners say they would not switch back to gasoline-powered cars, citing ongoing satisfaction.
Q: What are the main challenges holding back EV adoption?
A: The chief barriers reported are purchase price, battery repair costs, range anxiety, charging availability, and uncertainty about long-distance suitability.
Q: Which U.S. states are leading the electric vehicle transition?
A: California remains the clear frontrunner, followed by Florida, Texas, Washington, New York, and New Jersey. Each sets aggressive goals and rolls out state-specific incentives.
Q: Will EVs become the majority of new vehicles soon?
A: National adoption is accelerating but has not yet reached critical mass. If infrastructure and costs improve as projected, experts anticipate a sharp rise in the late 2020s as S-curve growth takes hold.
Conclusion: U.S. on the Verge of an Electric Future
While the pace of change has been slower than in some regions, the United States is warmed up and positioned for long-term transformation. Regional leadership, persistent consumer satisfaction, ambitious climate policies, and steady infrastructure growth form the foundation for permanent change in American transportation. The shift to electric vehicles—like all technology revolutions—may take time, but once the curve turns upward, it rarely goes back.
References
- https://digitaldealer.com/news/u-s-electric-vehicle-adoption-is-slow-but-often-permanent-mckinsey/164835/
- https://www.recurrentauto.com/research/states-leading-the-ev-revolution
- https://newsroom.aaa.com/2025/06/aaa-ev-survey/
- https://rmi.org/electric-vehicles-are-on-the-road-to-mass-adoption/
- https://www.autoweek.com/news/a37938642/electric-vehicle-sales-in-the-united-states/
- https://www.youtube.com/watch?v=RoqFrL3ZWsg
- https://www.greencarreports.com/news/1091625_tree-huggers-dont-buy-luxury-cars-says-cadillac-exec-on-electric-cars