


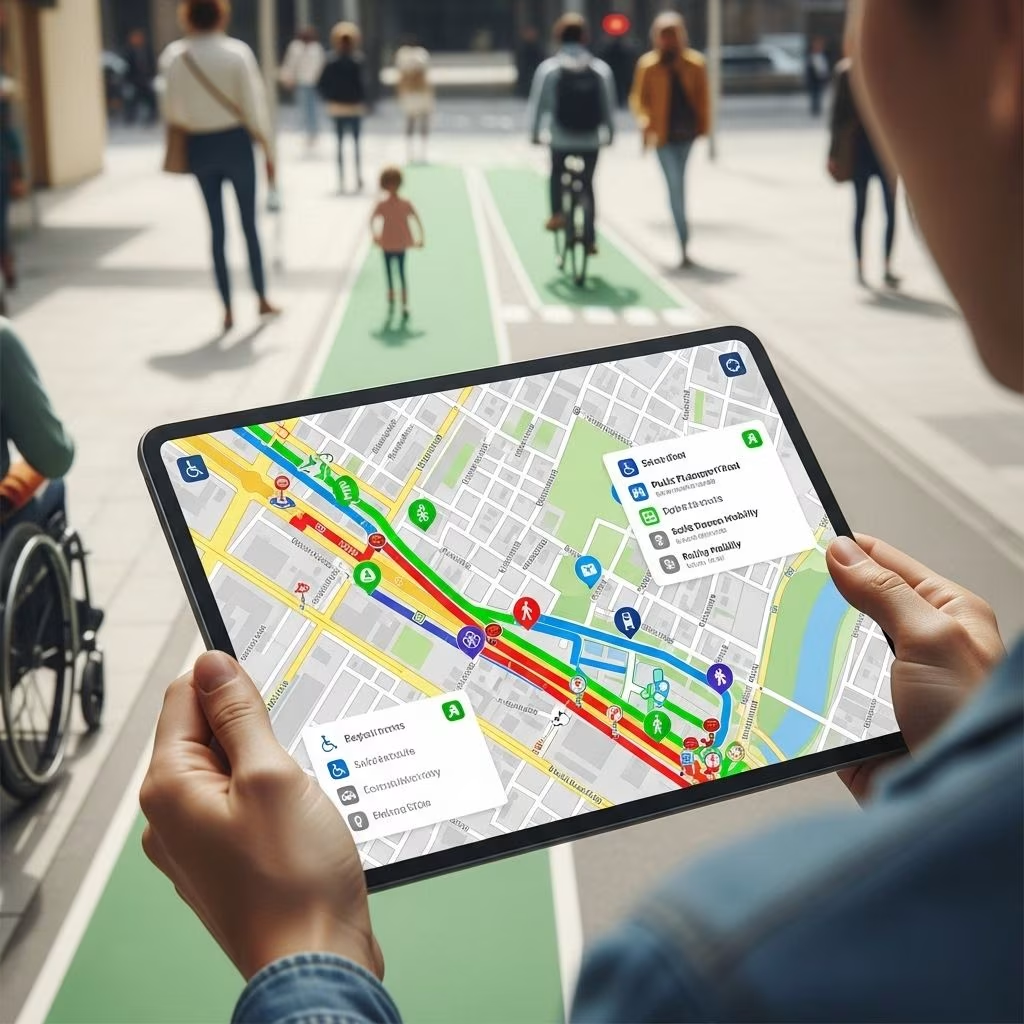
WalkRollMap: Crowdsourcing Safer Streets for All
City streets and sidewalks should be safe and accessible for everyone, whether they’re walking, using a wheelchair, pushing a stroller, or relying on other mobility devices. However, reality often falls short: crumbling sidewalks, missing curb cuts, vehicles blocking crosswalks, and other hazards make navigating urban environments risky and sometimes impossible for those with mobility challenges. WalkRollMap.org is an interactive, crowdsourced platform created to address exactly these issues by empowering residents to report the barriers they encounter and contributing to data-driven, inclusive city planning.
Why Accessibility and Safety Matter
Accessible, walkable neighborhoods are foundational to healthy, livable cities. They benefit everyone:
- Public Health: Safe walkways promote physical activity and reduce health risks.
- Environmental Impact: Walkable spaces encourage low-carbon transportation, helping combat climate change.
- Economic Opportunity: Walkable areas attract businesses, raise property values, and foster local economies.
- Equity and Inclusion: Those who cannot drive—children, seniors, people with disabilities—depend most on safe, accessible pedestrian infrastructure.
Yet, in many cities, sidewalks are narrow, broken, obstructed, or totally absent. Snow can pile up and remain uncleared. Busy intersections lack safe crossings. Traditional data sources, like police or insurance reports, rarely capture the daily realities pedestrians experience, especially minor hazards or near-misses that nevertheless create significant barriers.
What Is WalkRollMap.org?
WalkRollMap.org is a free, open-access online platform that collects, visualizes, and shares reports of pedestrian hazards, incidents, and missing amenities directly from community members. Anyone—from anywhere—can submit a report highlighting obstacles, safety concerns, or accessibility issues affecting the experience of walking or rolling (using wheelchairs, strollers, or other mobility aids) in public spaces.
- Simple and user-friendly interface, similar to Google Maps.
- Open data model All data is publicly accessible, fostering transparency and community participation.
The goal is to fill critical data gaps left by traditional authorities, empower residents to share their lived experience, and drive meaningful improvements to pedestrian environments across Canada and beyond.
How WalkRollMap Works
Making a Report
Submitting a report on WalkRollMap is designed to be intuitive and takes just a few minutes:
- Go to WalkRollMap.org on any internet-connected device.
- Zoom in on the map to the location where you encountered a problem.
- Drop a pin and select the type of report:
- Hazard or Concern (e.g., crumbling sidewalk, blocked curb cut, unsafe crossing)
- Missing Amenity (e.g., no bench, missing sidewalk, lack of lighting or ramps)
- Incident (e.g., fall, collision, near-miss with a vehicle or cyclist)
- Optionally provide demographic details like year of birth, gender, or ethnicity. (This information is anonymized and helps researchers understand how experiences differ among groups.)
Types of Data Collected
- Hazards: Surface issues, trip hazards, seasonal barriers (like snow), drivers not yielding, dangerous intersections.
- Missing Amenities: Lack of essential infrastructure—curb cuts, sidewalks, benches, lighting, signage.
- Incidents: Collisions, falls, near-misses—often overlooked by official channels.
Impact on City Planning and Accessibility
The collective power of community reporting enables urban planners and advocacy groups to:
- Identify accessibility pain points and ‘hotspots’ for intervention.
- Visualize gaps in infrastructure that standard audits might overlook.
- Supplement official reports—since many hazards or near-miss incidents are never reported to authorities.
- Engage communities that are most impacted but historically underrepresented in decision-making processes.
WalkRollMap’s data are already being used in active transportation plans in places like Victoria, BC, and Esquimalt, highlighting how grassroots data can directly shape municipal priorities and investments.
Who Can Benefit?
The WalkRollMap project is designed for everyone who moves through our cities outside of a private car. Specific beneficiaries include:
- People with Disabilities: Identifies and addresses barriers that limit independence and participation.
- Older Adults: Makes communities more age-friendly and navigable.
- Children and Families: Provides safer routes to schools, parks, and community centers.
- Urban Planners and Policymakers: Offers actionable, hyper-local insights from those who know their neighborhoods best.
Real-World Examples and Report Hotspots
Some common barriers and issues reported on the platform:
- Uneven or broken sidewalks that present trip hazards.
- Sidewalks blocked by construction, snow, or parked vehicles.
- Missing curb cuts that make wheelchair access impossible.
- Intersections where drivers routinely do not yield to people crossing.
Report data has so far shown that inaccessible sidewalks top the list, followed by dangerous driver behavior at pedestrian crossings. Yet, the creators of WalkRollMap emphasize the importance of engaging a diverse range of voices—since each person’s experience of the built environment is unique.
How Data Drives Change
The core mission of WalkRollMap is to ensure that problems don’t just get mapped—they get addressed. Here’s how:
- Open Data Access: Anyone—residents, advocacy groups, or government officials—can explore and analyze the map to identify the most urgent concerns.
- Evidence-Based Planning: Cities can use WalkRollMap’s reports to inform:
- Active transportation and accessibility plans
- Prioritization of repairs and new infrastructure
- Seasonal maintenance like snow clearing
- Transparency and Accountability: Publicly accessible reports ensure decision-makers can be held responsible for addressing community-identified hazards.
- Inclusive Solutions: By collecting demographic information, WalkRollMap uncovers disparities in accessibility and safety, informing targeted interventions.
The Technology Behind WalkRollMap
Inspired by the earlier success of BikeMaps.org (which collects data on bicycle crashes and hazards), WalkRollMap adapts proven technology to focus on pedestrian and mobility device users. The platform’s strength lies in its simplicity and openness:
- Mapping interface: Visually intuitive, leveraging the familiarity of commercial mapping services.
- Anonymity and privacy: Personal information remains confidential; data is only analyzed in aggregate form.
- Device agnostic: Works seamlessly from any smartphone, tablet, or desktop computer.
Developed by researchers with extensive backgrounds in geography, urban planning, and public health, WalkRollMap is supported by funding from Canada’s Public Health Agency.
Collaboration and Community Engagement
WalkRollMap is both a research project and a civic engagement tool. Its development brings together:
- Academic research teams, including Dr. Trisalyn Nelson (UCSB Geography and UVic), Dr. Meghan Winters (SFU), and Dr. Daniel Fuller (Memorial University).
- Municipal partners who use the data to guide their infrastructure projects.
- Community advocates working to make streets safer for all users.
Feedback is actively encouraged. The project team continually refines the map and reporting process in response to user suggestions, aiming to make the tool even more inclusive and effective over time.
Comparing WalkRollMap to Traditional Approaches
| Traditional Data Collection | WalkRollMap Model |
|---|---|
| Relies on police, insurance, and official municipal reports | Any resident can quickly and anonymously report an incident, hazard, or missing amenity |
| Often misses near-misses, minor hazards, and daily accessibility barriers | Captures granular, “real life” data including near-misses and inconvenience |
| Limited demographic insight | Demographic data (optional) reveal disparities in experiences across gender, age, and ethnicity |
| Data may be siloed or inaccessible to the public | Open-access data: everyone can view, analyze, and use the reported information |
Challenges and Future Directions
The creators of WalkRollMap recognize that truly inclusive reporting involves reaching people from all backgrounds, not just those already aware of accessibility issues. The project seeks to:
- Expand outreach to diverse communities, particularly underrepresented voices.
- Improve the mapping interface to be as inclusive and intuitive as possible.
- Work closely with cities to ensure that map data translates into real-world change.
- Encourage developers and planners to prioritize “complete streets” that serve all users—walkers, rollers, cyclists, and motorists alike.
The team welcomes ongoing feedback to continuously improve both the tool and its community impact.
Get Involved: Reporting and Advocacy
WalkRollMap’s success relies on community participation. Whether you are a pedestrian, use a mobility device, or simply want safer streets for all, you can:
- Submit reports of hazards, obstacles, and incidents you encounter.
- Share the platform with your community or local advocacy groups.
- Contact city officials to use WalkRollMap data in planning and investments.
- Provide feedback on the reporting experience to help refine the tool.
Frequently Asked Questions (FAQs)
Q: Who can use WalkRollMap?
A: Anyone with internet access can view the map and submit reports about pedestrian barriers and incidents, regardless of location.
Q: What types of hazards should I report?
A: You can report any sidewalk or street barrier affecting safe walking or rolling, such as broken surfaces, missing curb cuts, blocked paths, poor lighting, or unsafe intersections.
Q: How is my data used?
A: Reports are anonymized and shared with municipal planners, advocacy groups, and the broader public to guide infrastructure improvements and inform policy.
Q: Is my personal information safe?
A: Yes. While you can provide optional demographic information, all personal details are kept strictly confidential—public data is aggregated and does not identify individuals.
Q: What if my city doesn’t use WalkRollMap yet?
A: You can still submit reports anywhere. As community engagement grows, more cities are recognizing and utilizing WalkRollMap data in their planning processes.
Q: How can I support WalkRollMap?
A: Make a report, spread the word, contribute your feedback, and connect with local advocacy groups or municipal leaders to help drive safer, more accessible streets for all.
Conclusion
WalkRollMap marks a significant step forward in modern urban planning—bridging the gap between official statistics and everyday experience. By crowdsourcing reports of hazards and obstacles, WalkRollMap not only gives a voice to those most impacted by inaccessible infrastructure but also empowers individuals, communities, and cities to work together toward safer, more inclusive streets. Every report counts, and collectively, they have the power to reshape our neighborhoods for the better.
References
- https://chatrlab.ca/projects/walk-roll-map/
- https://www.bcdisability.com/post/walk-roll-map
- https://www.aacounty.org/sites/default/files/2023-05/walk-and-roll.pdf
- https://www.tukwilawa.gov/wp-content/uploads/DCD-Walk-and-Roll-Program.pdf
- https://walkrollmap.org/about
- https://www.commuteoptions.org/wp-content/uploads/2025/03/Walk-and-Roll-E-Toolkit-1.0-with-Attachments_Fall-2020.pdf
- https://www.paloalto.gov/Departments/Transportation/Safe-Routes-to-School/Walk-and-Roll-Suggested-Route-Maps
- https://lvpc.org/active-transportation
- https://www.ourclimateourfuture.org/activity/walk-and-roll-day/