

How 2020 Changed U.S. Energy Consumption: The Pandemic Impact
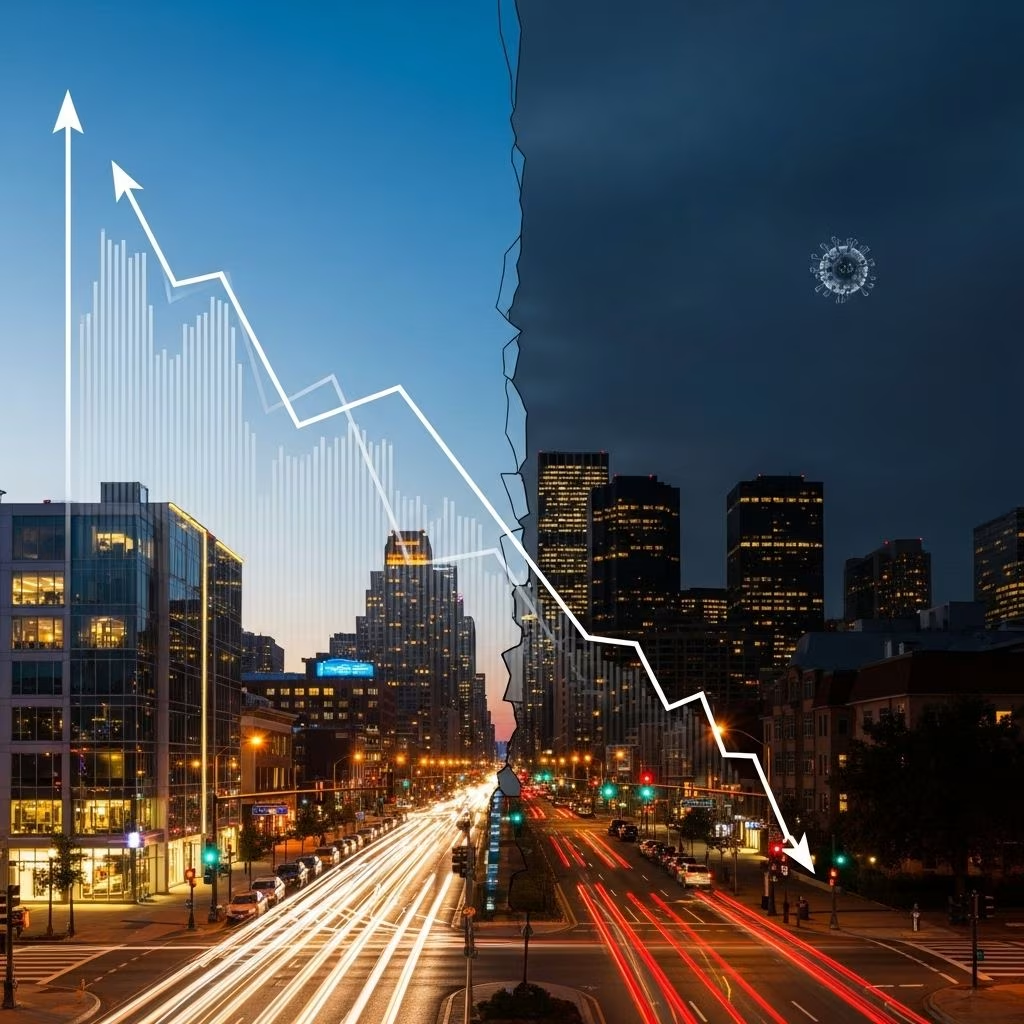
The year 2020 stands as a turning point in U.S. energy history. As the COVID-19 pandemic spread around the globe and sweeping public health restrictions followed, America’s energy use underwent a dramatic transformation. From empty highways to shuttered office buildings and a surge in remote work, 2020 forced a collective pause that reshaped patterns of electricity, fuel mix, and sectoral energy demands.
2020: An Unprecedented Year in U.S. Energy History
According to data compiled by the Energy Information Administration (EIA) and national laboratories, U.S. energy consumption fell by 7% in 2020 compared to the previous year—a decline unmatched since record-keeping began in 1949. Americans used an estimated 92.9 quadrillion British thermal units (quads) of energy, down from 100.1 quads in 2019. This drop is not only historic in its size but also notable for the speed and causes of the decline.
- Largest annual percentage drop on record
- Previous largest single-year decline was 5% from 2008 to 2009, during the Great Recession
- All major sectors of the U.S. economy saw declines in energy use
While recessions in the past triggered energy demand reductions, the unique combination of business shutdowns, travel bans, and remote work made the 2020 decline distinct in both scope and sectoral impact.
The Key Numbers Behind the Drop
What is a quadrillion BTUs? It’s a colossal unit: one quadrillion British thermal units (1 quad) is approximately the amount of energy needed to power over 26 million American homes for a year. In 2020, the nation used 92.9 quads, down 7.2 quads (or 7%) from the previous year.
| Year | Total U.S. Energy Consumption (quads) | Annual Change (%) |
|---|---|---|
| 2018 | 101.2 | +1.5 |
| 2019 | 100.1 | -1.1 |
| 2020 | 92.9 | -7.2 |
The cause: Not an energy crisis, but a global health crisis—the COVID-19 pandemic—which led to an unprecedented drop in economic activity and daily mobility.
The Pandemic’s Influence Across Energy Sectors
Transportation: The Biggest Decline
The energy-intensive transportation sector suffered the deepest cuts. With travel restrictions, lockdowns, and a sudden evaporation of commuter traffic, U.S. transportation energy consumption fell by 15% to 24 quads in 2020.
- Jet fuel use dropped 38% as flights were grounded and air travel plummeted.
- Motor gasoline (for cars and light trucks) demand declined by 13%.
- Diesel fuel (distillate) consumption fell by 7%.
Though some movement resumed later in the year, demand remained far below pre-pandemic levels, especially in aviation.
Commercial Sector: Offices and Public Spaces Go Dark
Commercial buildings—offices, schools, malls—emptied in 2020, driving commercial energy use down by 7% to less than 17 quads.
- Natural gas consumption in the commercial sector dropped 11%.
- Electricity retail sales to commercial buildings fell by 6%.
- Businesses closed or shifted to remote operations, while a warmer winter further reduced heating needs.
Industrial Sector: Reduced Output, Reduced Energy
The industrial sector also contracted, albeit less sharply, with energy use declining by 5% to 31 quads. As U.S. demand for manufactured goods, construction, and fuel production diminished, so did the sector’s electricity and fuel consumption.
- Coal consumption by industry plunged 16%.
- Petroleum use declined by 4%.
- Natural gas use fell by 2%.
- Industrial electricity sales decreased by 8%.
Manufacturing output, energy-intensive refining, and resource extraction were all less active in 2020, directly impacting the industries’ appetite for energy.
Residential Sector: Americans Stay Home
Despite expectations, the residential sector saw only a 1% reduction in energy use to just under 21 quads. Sales of electricity to homes actually rose by 2% as millions of Americans adjusted to work-from-home and remote schooling requirements. Houses buzzed with energy use for lighting, home offices, and entertainment, even as commercial spaces sat idle.
- However, residential consumption of biomass (such as wood) fell 16%.
- Petroleum use in homes dropped by 11%.
- Natural gas demand for heating fell by 7%, aided by a relatively warm winter.
The increase in home electricity use was offset by declines in other energy types, resulting in a net minimal sectoral change.
The Fuel Mix: Who Lost and Who Gained
The pandemic saw not only a reduction in absolute consumption but also shifts in America’s energy mix—with renewable sources making unexpected gains while coal and petroleum use contracted further.
Coal’s Continued Decline
- Coal consumption dropped sharply, replaced by natural gas and renewables in electricity generation.
- Confirms long-running trends of coal’s decline in the U.S. grid.
Natural Gas: Mixed Results
- Total natural gas use fell by 2%.
- Sharp declines in residential and commercial heating offset by increased use in the power sector to generate electricity as coal was retired.
Renewables: A Bright Spot in a Dark Year
- Wind energy grew by 10% in 2020.
- Solar energy soared by 19%.
- With overall electricity demand only slightly lower, renewables largely replaced lost coal generation, increasing their grid share.
Petroleum: Hit Hardest
- Petroleum remains the largest single source of U.S. energy—but use fell most significantly, especially in transportation as travel ground to a halt.
Rejected Energy: Wasted Potential Drops
An oft-overlooked component of U.S. energy data is rejected energy—the portion of energy lost as heat and inefficiencies during use and conversion. In 2020, as total consumption decreased and efficiency improved, rejected energy also dropped by 7%. Most wasted energy comes from vehicle exhaust, inefficient furnaces, and the conversion losses at power plants. Any progress in reducing wasted energy is a positive step for overall system efficiency.
How 2020 Compares to Other Slumps
The 7% drop in national energy use in 2020 is the largest in both percentage and absolute terms on record, outstripping even the 5% dip during the 2008–09 recession.
- 2020: -7% (COVID-19 pandemic)
- 2008–09: -5% (Great Recession)
- Early 1980s: ~3% (Economic contraction)
This magnitude of demand reduction was previously only seen during deep nationwide recessions and oil shocks, underscoring the extraordinary circumstances of the pandemic year.
The Outlook: Lasting Change or Temporary Disruption?
While the pandemic’s grip has loosened since 2020, its legacy may persist in reshaped work habits, a renewed focus on home energy efficiency, and ongoing interest in cleaner power sources. Energy analysts caution against assuming every change will stick, but several takeaways emerge:
- Remote work could lead to more durable growth in residential electricity use.
- Permanent reductions in business travel may keep transportation fuels demand lower.
- The accelerating shift toward renewables may be reinforced as utilities and governments prioritize cleaner, more resilient power grids.
- The resilience and adaptability of the U.S. energy system were stress-tested and, in many ways, proved robust.
Energy Flow Chart: Summarizing Inputs and Outputs
Each year, national laboratories such as Lawrence Livermore National Laboratory (LLNL) produce detailed energy flow diagrams to visualize sources, conversions, losses, and final uses across the economy. In 2020, these charts illustrated:
- Sharp declines in every fossil fuel except for natural gas (which was stable for power generation)
- Growth in renewables, especially wind and solar
- Efficiency improvements (reduced rejected energy)
Key Takeaways
- 2020 saw the largest drop in U.S. energy consumption in history: 7% down from 2019.
- Every major sector declined, with transportation (airlines, driving) falling most sharply.
- Renewable power generation was one of the few winners, displacing coal and expanding its grid share.
- Residential energy use was resilient, with a shift from offices to homes for work and education.
- Less wasted energy (rejected energy) reflected both lower demand and improved efficiency.
Frequently Asked Questions (FAQs)
Q: Why did energy use fall so much in 2020?
A: The COVID-19 pandemic triggered sweeping restrictions on business, travel, and public activity, causing sharp declines in transportation, industrial, and commercial energy use.
Q: Did all energy sources decline equally?
A: No, fossil fuels like petroleum and coal fell most, especially as travel halted and coal-fired power declined. Renewables like wind and solar, by contrast, expanded even as overall demand shrank.
Q: Was residential energy use affected by the pandemic?
A: Residential sector energy use fell just 1%, with increased electricity use for remote work and learning but less heating demand due to a warm winter and lower consumption of other fuels.
Q: Is energy use rebounding after 2020?
A: Preliminary data suggest that energy use is recovering as economic and travel activity normalizes, but some shifts such as more remote work and increased reliance on renewables may persist.
Q: How can the U.S. make further gains in energy efficiency?
A: Continued investments in building efficiency, electrification, adoption of renewables, and improvements in transportation technology (such as electric vehicles) can reduce rejected energy and emissions while supporting a reliable energy system.
References
- Lawrence Livermore National Laboratory: Pandemic drives down U.S. energy use in 2020
- U.S. Energy Information Administration: U.S. energy consumption fell by a record 7% in 2020
- Enerknol: U.S. Energy Consumption Reached Record Low in 2020
References
- https://www.llnl.gov/article/47441/pandemic-drives-down-us-energy-use-2020
- https://dailyenergyinsider.com/news/29805-eia-2020-saw-7-percent-decrease-in-u-s-energy-consumption/
- https://www.eia.gov/todayinenergy/detail.php?id=47397
- https://www.eia.gov/energyexplained/us-energy-facts/
- https://usafacts.org/articles/what-kinds-of-energy-does-the-us-use/
- https://enerknol.com/u-s-energy-consumption-reached-record-low-in-2020-eia/
- https://www.enerdata.net/estore/energy-market/united-states/
- https://pmc.ncbi.nlm.nih.gov/articles/PMC7834155/